


Collaborando £ 4
Gratitude: Acknowledgement on the Web
Your name will appear in the acknowledgement section on the Open Energy Web with your full name.
> 03 Co-finanziatori
Open Energy
A Fully Open Source Prototype of Domestic Energy Infrastructure
 Compito
|
Minimo | Ottimo |
|---|---|---|
|
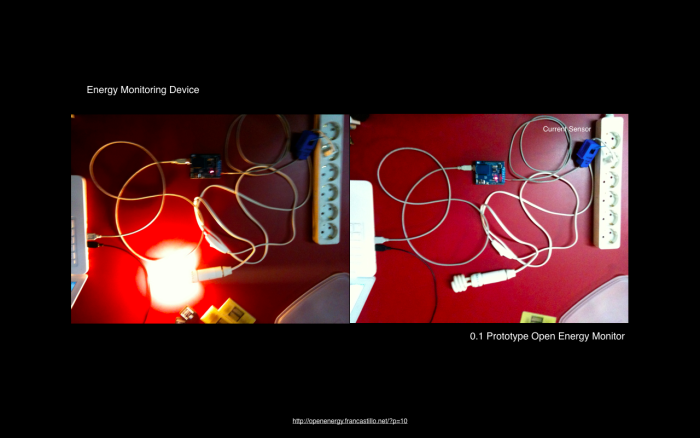
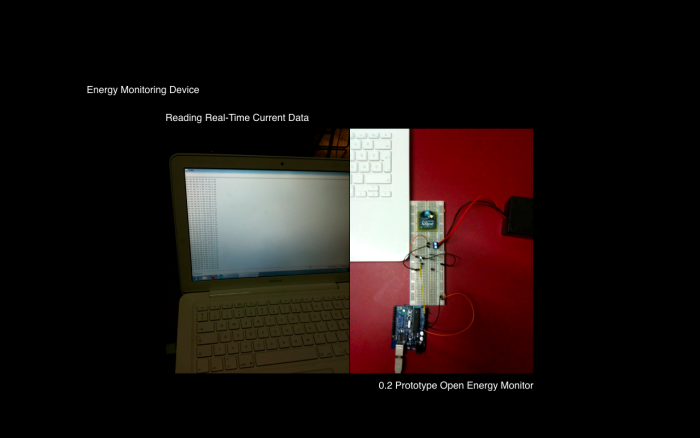
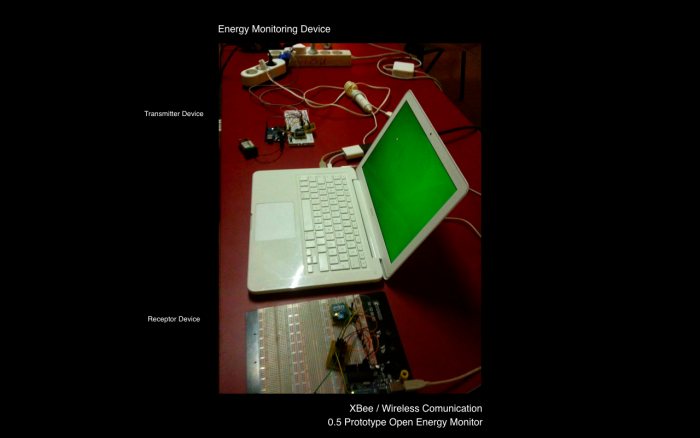
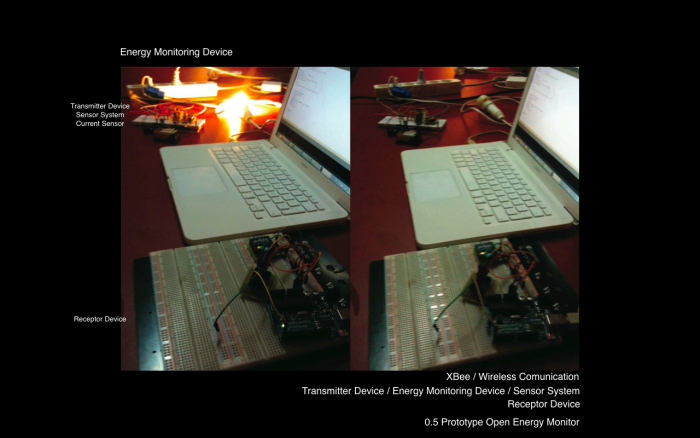
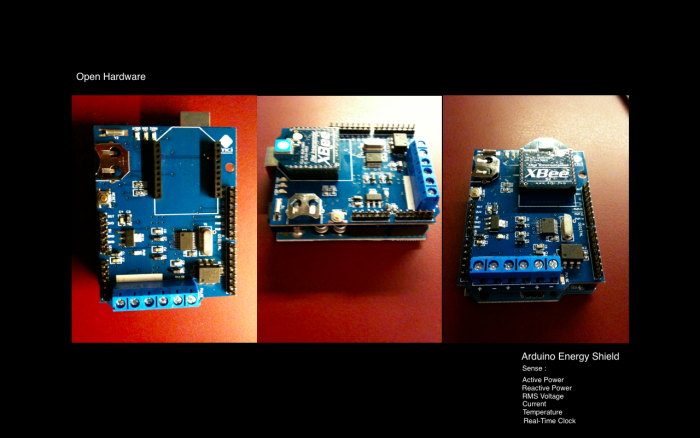
Energy Monitoring Device
Developing and Designing Hardware. Arduino Energy Shield / XBee, Transmitter Device / Receptor Device / Current Sensor. Developing Prototype A: Electric monitoring of a measurement point.
|
£ 2,068 | |
|
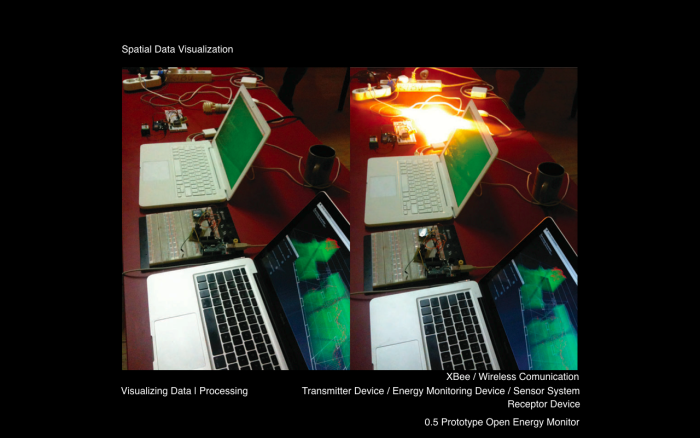
Real-Time Visualization Software
Programming Visualization Software, Designing Visualization Interface, Designing and Programming Open Energy Web.
|
£ 1,724 | |
|
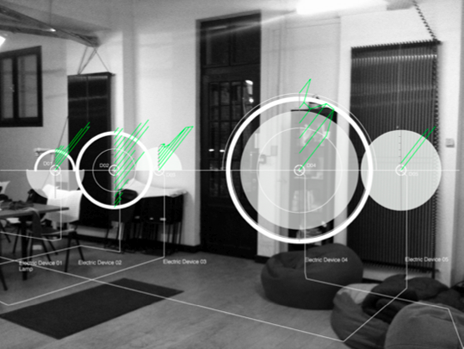
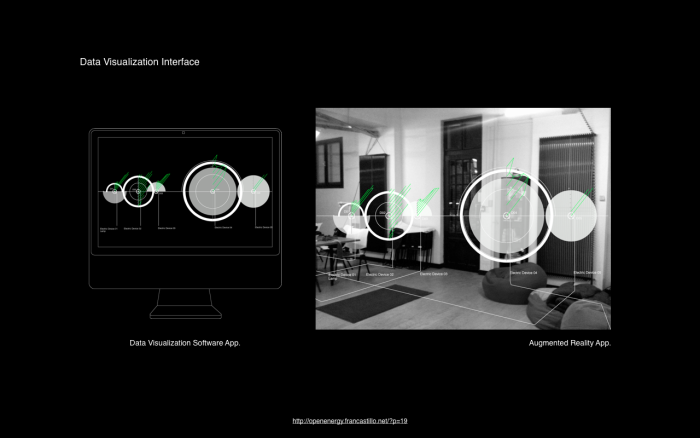
Real-Time Visualization / Augmented Reality
Programming Visualization Software, Designing Visualization Interface, Smartphone app/Augmented Reality and/or other visualization interfaces. Developing Prototype B: Electric monitoring (and visualization) of up to 5 measurement points.
|
£ 3,878 |
 Materiale
|
Minimo | Ottimo |
|---|---|---|
|
Material of Energy Monitoring Device
Materials for developing sensors system Energy Monitoring Device
|
£ 517 | |
| Totale | £ 4,309 | £ 8,187 |
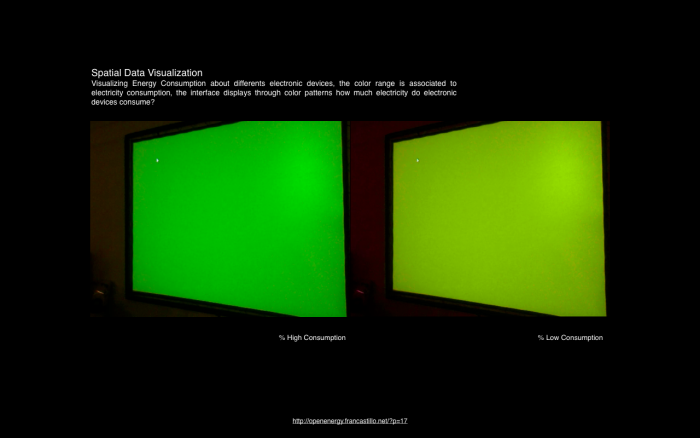
Open Energy aims to develop a platform to explore new systems of visualization energy use and to optimize it accordingly, both in domestic and industrial environments.
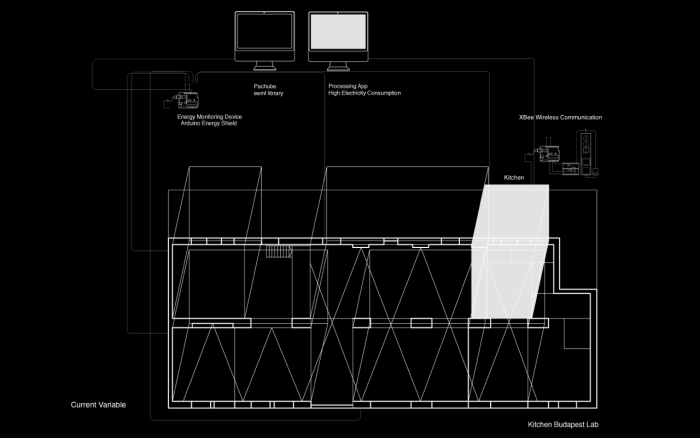
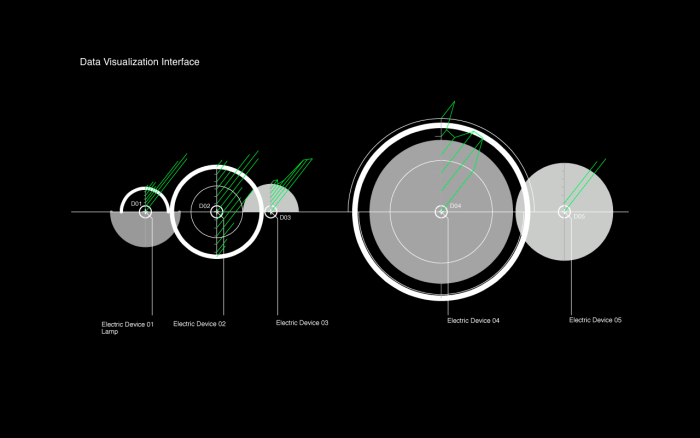
The system is built along two dimensions: first one, Energy Monitoring Device, which investigates open hardware devices in which monitoring power consumption, and a second dimension, Open Energy Visualization (Data Visualization / Augmented Reality App), which explores new ways of real-time visualization power consumption in domestic environments.
These systems will allow us to amplify our knowledge about the dynamic behavior of energy anywhere.
Open Energy is a prototype of energy infrastructure completely open source.
In view of the upcoming stage of evolution of Internet of Things (es.wikipedia.org/wiki/Internet_de_las_Cosas), Open Energy considers the design of a visualization system which is inserted into a new energy distribution model, where invention of technologies will allow a decentralized redistribution of electricity production at a global scale, defining new frameworks of sustainable balance.
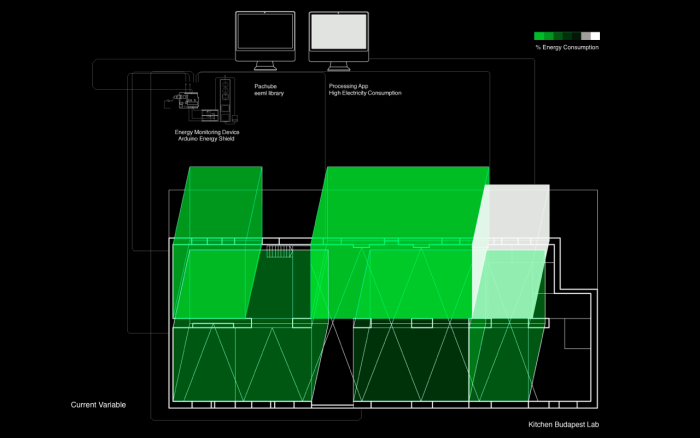
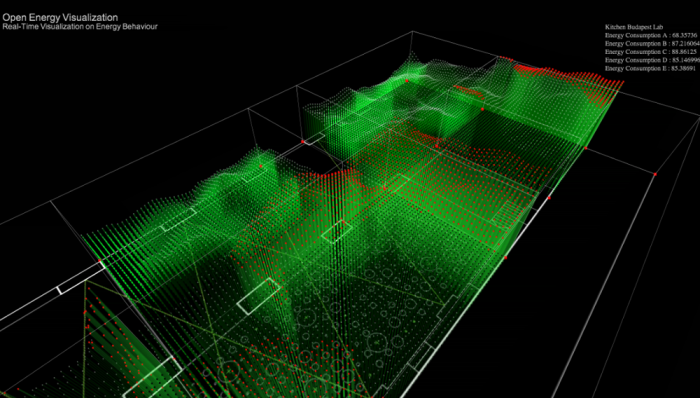
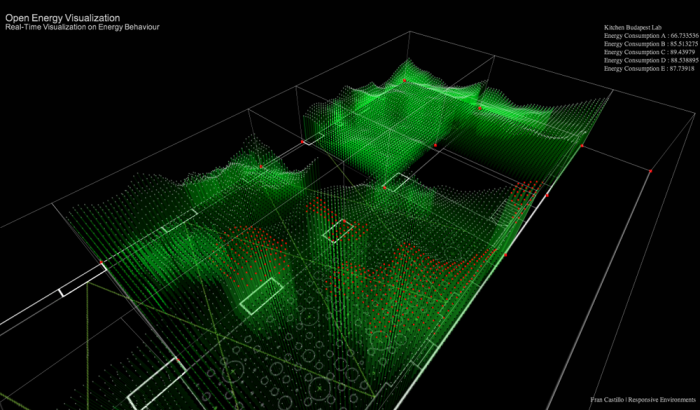
Open Energy Visualization (OEV) is a real-time visualization software on power consumption (kWh) and CO2 levels (g) at home. OEV seeks to implement the design of a Smart Grid system (intelligent electric distribution network) by inventing visualization technologies, sensors system and autonomous electricity production, allowing greater optimization of the energy distribution globally.
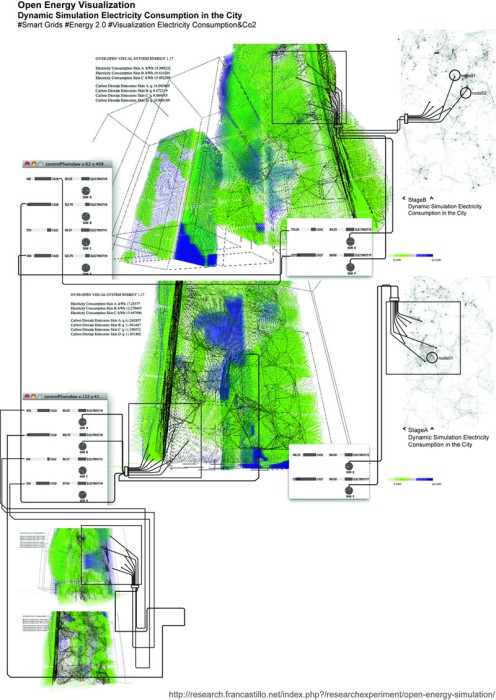
This visualization structures will allow new ways of relationship between energy and humans. Real-time visualization of power consumption patterns, and simulation of predicting consumption, will constitute new information systems through of whom we would be able to visualize power consumption, CO2 levels, nodes which have greater surplus in energetic production, real-time value of the electricity, etc.
This new model of smart grid, in opposition to the traditional model of hierarchical grid, presents designing a decentralized energy system, where anyone can become a generator node and a distributor of renewable energy. Open Energy as visualization environment generates new not perceptible representations of electrical dynamic behavior of humans in their living environment. These real-time visualization systems will enable us to adapt consumption behavior patterns in relation to consumption levels.
Product A: Domestic Application for Energy Saving
The system will have a simple software interface, where users impute monthly its current power consumption in euros and the power consumption desired for the current month. With these data, the interface will report the actual instantaneous consumption and accumulated consumption in the current month so, on the basis of feedback and this information, we can act accordingly and reach the monthly savings goal.
Product B: Application for Energy Saving in Small Industrial Environments
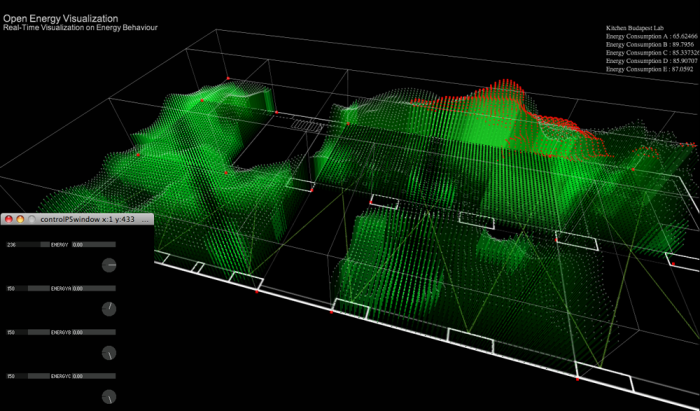
In addition to above previously described product, the system will have several consumption measurement points (up to 5), such in a way that different consumption areas can be identified and they could be balanced, taking into consideration (when applicable) stand-by consumptions.
The project aims to develope a community around the Open Energy concept, developing monitoring and visualization systems to allow us, on one hand, to amplify our knowledge about energy and, on the other hand, explore development of an open infrastructure for a new energetic distribution model, through the Smart Grids/Smart City concept.
Open Energy is intended for any citizen and/or groups interested in knowing (and optimizing) energetic behavior in their homes and/or urban systems, through different tools of real-time visualization.
The goal is developing an electricity monitoring prototype and real-time visualization interfaces.
It’s intended to generate a community of citizens interested in new ways of management energetic systems, based on open technologies.
Fran Castillo (@francastillo) is an Architect/ETSAS and Interaction Designer /UPF. He is currently research director at Responsive Environments. Between his projects, stand out Ecovisualización-Ecoanalogización, developed at Medialab-Prado Madrid, and Augmented Ecologies, recently chosen in 2011 Subtle Technologies Festival Toronto, awarded with first prize in the 4th Advanced Architecture Contest IAAC “City Sense” Barcelona 2011, and in 2011 International Residency Program KIBU´S / Kitchen Budapest. Magyar Telekom's Innovation Lab, and I Digital Culture Festival UBICUA´11 Sevilla 2011. It was also chosen at 2011 Eme3 International Architecture Festival / COAC / ARTS SANTA MÓNICA / DHUB / ELISAVA Barcelona. Coimpulsor of Festival Pecha Kucha Night Sevilla. His work has been exhibited in Medialab-Prado/Madrid, Pecha Kucha Nights/Sevilla, La Casa Encendida/Madrid, Centro Andaluz de Arte Contemporáneo/Sevilla, COAC/Colegio Oficial Arquitectos Cataluña/Barcelona, Subtle Technologies Toronto, Kitchen Budapest Medialab/Budapest and Dutch Design Week /Eindhoven.
Óscar Marín Miró (@oscarmarinmiro) is a Telecommunications Engineer from Universidad Politécnica de Madrid, and he has 13 years of working experience in Developing Software. His main research focus is currently “give meaning to data”. His interests are spread over a wide range of research areas, as: Feeling and Humour Analysis, Social Network Analysis (dinamic and static), Wikipedia Mining, Language Dinamic, Visualization of data, Phisical Interfaces, Internet of Things, Natural Language processing, Information Retrieval at large scale and Augmented Reality. He worked as Director of Innovation at Paradigma Tecnológico (labs.paradigmatecnologico.com/) until Feburary of 2012. He is currently working as Freelance with HAVAS Media, as Data Engineer, at SEED Studio as Professor and Data Visualization Partner and at Paradigma Tecnológico as Sales and Project Planning Engineer.
Christian Szucher is Electronic Engineer from Instituto Tecnológico de Budapest.
Collaborating groups:
SEED
Lugadero
Weall
Pecha Kucha Night Sevilla.
Asociación seiscuarenta
Responsive Environments
Collaborating Medialabs:
He collaborated in the development of the first prototype Kitchen Budapest Lab / Magyar Telekom's Innovation Lab www.kitchenbudapest.hu/en/
*I would like to thank José Mª Raya Bejarano greatly, He is the author of english translation, thanks so much José Mª¡

